Final Presentations!
12-11-18
Yonut Video:
Step-by-step assembly:
Cost Analysis:
Below is an analysis of the different parts and the dimensions across each part for the 50 yo-yo's made.


Yonut Video:
Step-by-step assembly:
- First clip the donut bottom onto the plate
- Attach donut frosting into donut top
- Clip donut top onto donut bottom
Cost Analysis:
Below is an analysis of the different parts and the dimensions across each part for the 50 yo-yo's made.
Quality/Variation Analysis:
To better understand our manufacturing process, we analyzed the 100+ parts we created for our 50 yo-yo’s. This allowed us to analyze the consistency of our design process and how effectively we were able to create equivalently dimensioned parts.
When conducting our analysis we used sample size groupings of 5 pieces.
This was done as we felt across 5 measurements we would be able to get a strong estimate of what
the true value was, and then averaging a high enough sample of these averages (20) we would be able
to come up with an accurate representative average value for our data.
Since we used 5 data points in our sample groupings, we used the following value parameters found in
the table below: A2 = 0.577, D4 = 2.115, D3 = 0, d2 = 2.326.
the table below: A2 = 0.577, D4 = 2.115, D3 = 0, d2 = 2.326.
Our analysis and yo-yo construction consisted of 4 parts. One thermoformed part (the frosting), and
three injection molded parts (the donut top and bottom, and the plate).
three injection molded parts (the donut top and bottom, and the plate).
For each part we picked a critical dimension to measure and compare across our 100+ manufactured
parts.
parts.
Thermoformed part (donut frosting):
The critical dimension we chose for the frosting was, the outer flower dimension.
Insert Image of thermoformed part with drawing of the dimension
After analyzing the data, the following critical values were found:
Xbar (inches)
|
1.87
|
Lower control Limit (mean)
|
1.84
|
Upper control limit (mean)
|
1.90
|
Avg of range
|
0.06
|
Lower control limit (range)
|
0.00
|
Upper control limit (range)
|
0.11
|
Below, 3 graphs were made to represent the data.
The graphs include: a graph tracking the mean, the range and a histogram of the data.
The graphs include: a graph tracking the mean, the range and a histogram of the data.
Figure 1: The above graph tracks the data of the thermoformed frosting in comparison
with the upper and lower control limits (of the data), as well as the mean of the data.
Figure 2: The above graph tracks the range of the thermoformed frosting, with the average of the
range and the upper and lower control limits also plotted.
Figure 3: The above graph is a histogram of the dimensions for our thermoformed frosting.
For this data set the CP value was found to be: CP = 0.18
For this data set the CPK value was found to be: CPK = 0.38
1st Injection molded part:
Donut bottom:
The critical dimension we used for our donut bottom was the inside diameter of the press fit.
Insert Image of donut bottom with drawing of dimension
After analyzing the data, the following critical values were found:
Xbar (inches)
|
2.08
|
Lower control Limit (mean)
|
2.08
|
Upper control limit (mean)
|
2.09
|
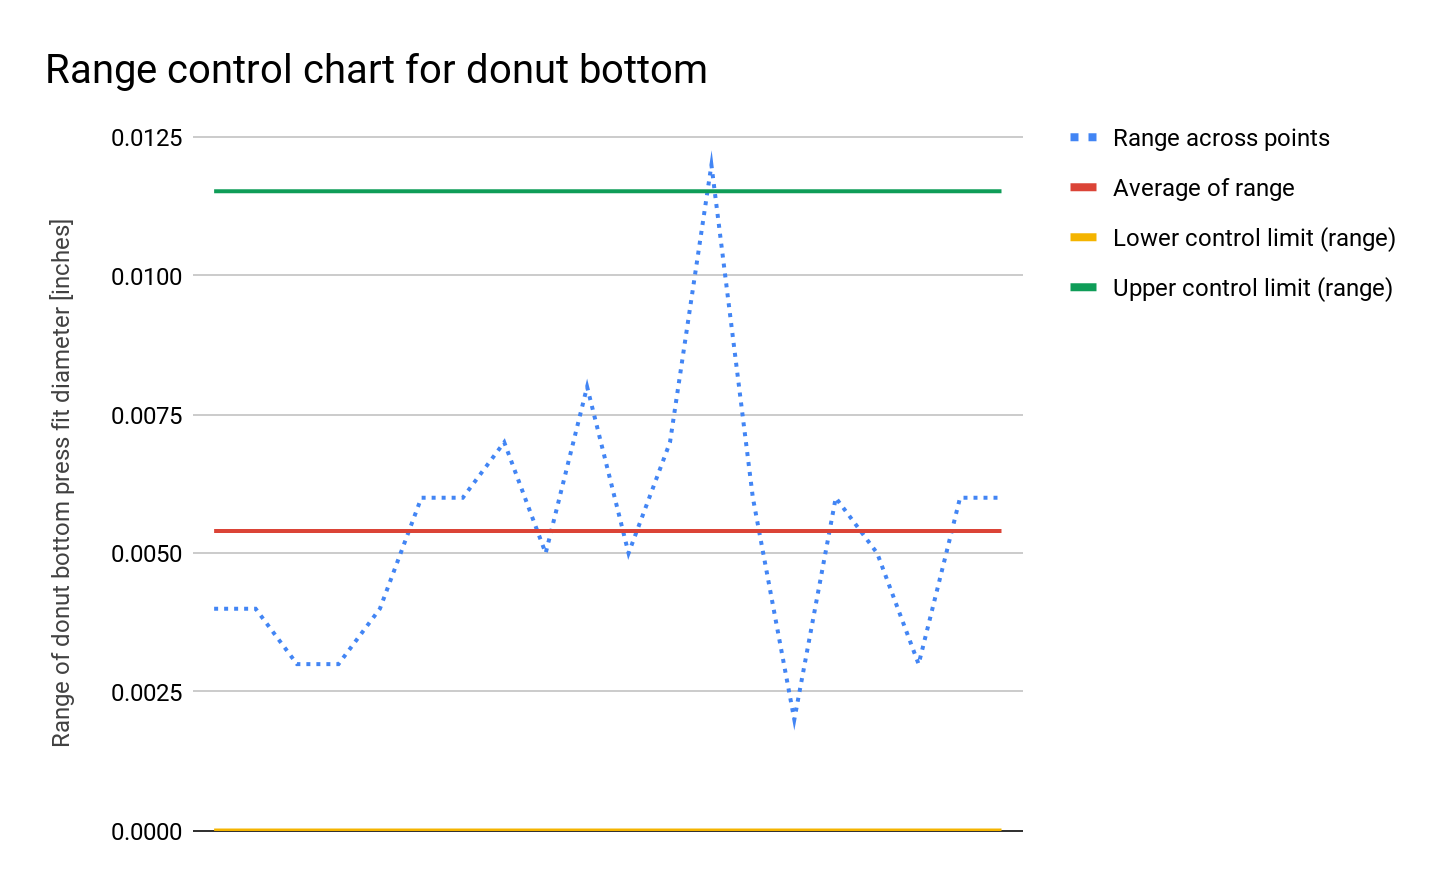
Avg of range
|
0.01
|
Lower control limit (range)
|
0.00
|
Upper control limit (range)
|
0.01
|
Below, 3 graphs were made to represent the data. A graph tracking the mean, the range and a
histogram of the data are presented below.
histogram of the data are presented below.
Figure 4: The above graph tracks the donut bottom critical dimension data in comparison with the
upper and lower control limits as well as the mean of the data.
Figure 5: The above graph tracks the range of the injection molded donut bottom, with the
average of the range and the upper and lower control limits also plotted.
Figure 6: The above graph is a histogram of the dimensions for our donut bottom.
For this data set the CP value was found to be: CP = 2.00
For this data set the CPK value was found to be: CPK = 0.40
2nd injection molded part:
Donut top:
The critical dimension we chose for the donut top was the inner diameter of the outer layer of the donut.
Insert Image of donut top with drawing of the dimension
After analyzing the data, the following critical values were found:
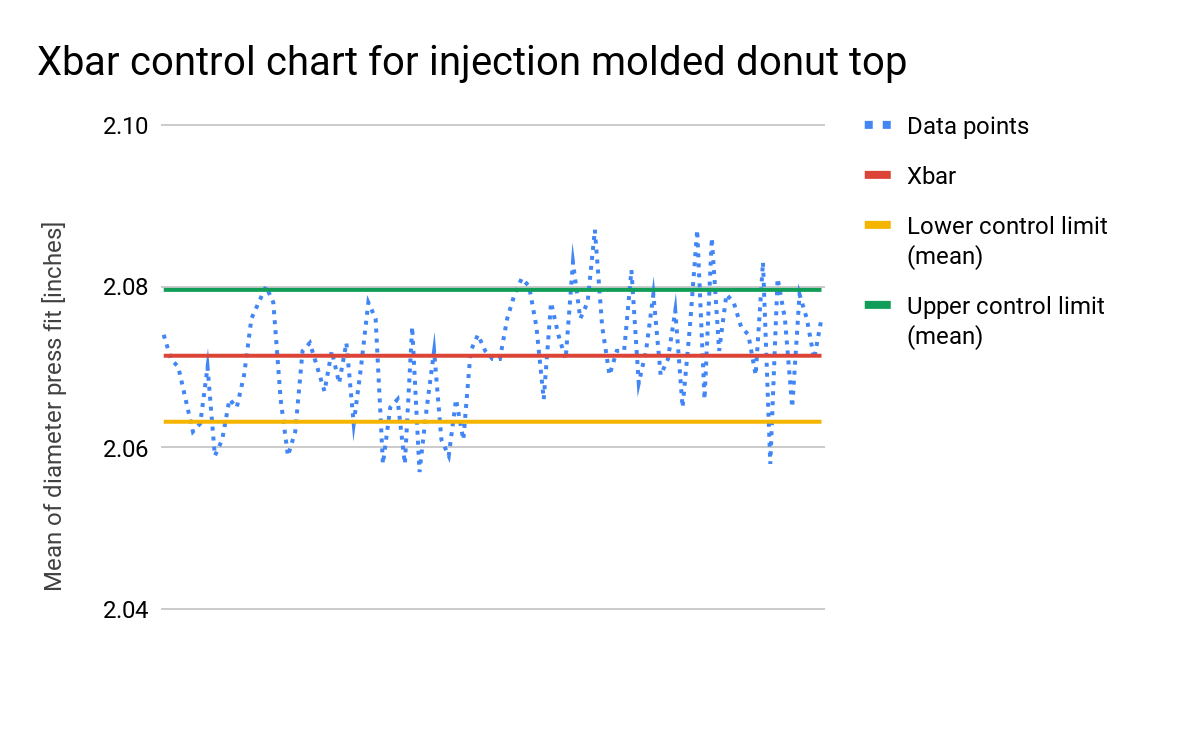
Xbar (inches)
|
2.07
|
Lower control Limit (mean)
|
2.06
|
Upper control limit (mean)
|
2.08
|
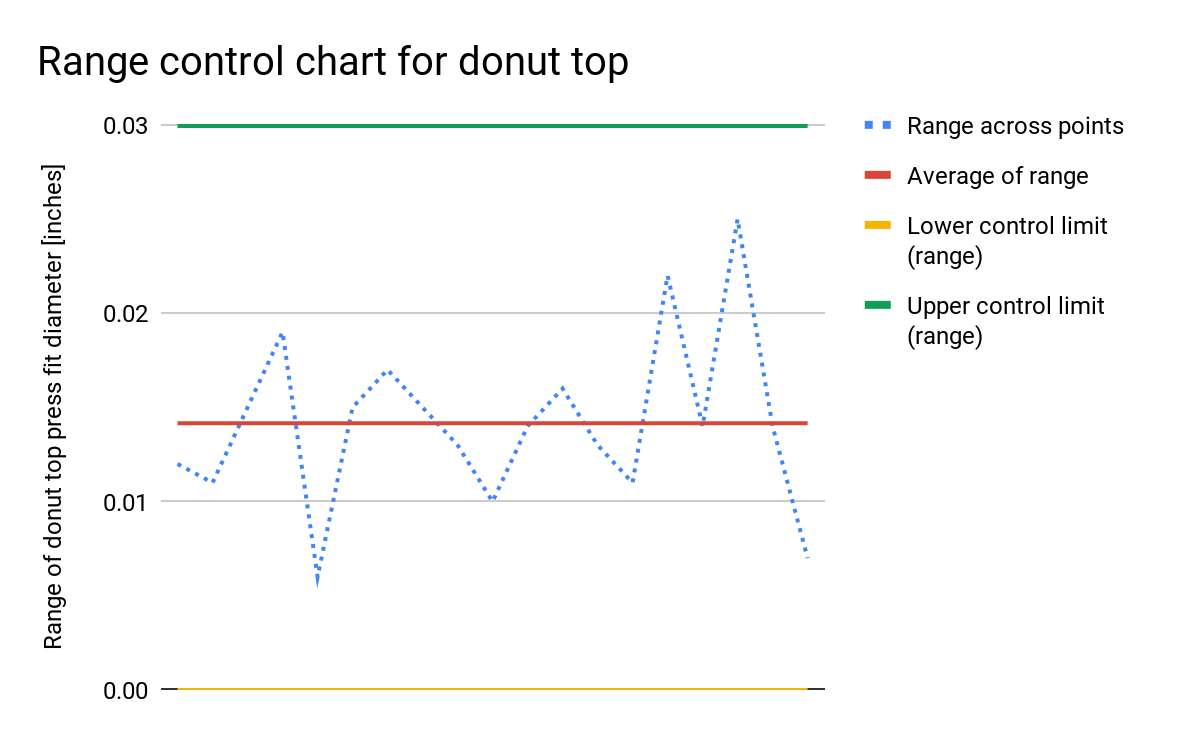
Avg of range
|
0.01
|
Lower control limit (range)
|
0.00
|
Upper control limit (range)
|
0.03
|
Below, 3 graphs were made to represent the data. A graph tracking the mean, the range and a
histogram of the data are presented below.
histogram of the data are presented below.
Figure 7: The above graph tracks the data for the donut top, in comparison with the upper and lower
control limits as well as the mean of the data.
Figure 8: The above graph tracks the range of the donut top, with the average of the range and the
upper and lower control limits also plotted.
Figure 9: The above graph is a histogram of the dimensions for our donut tops.
For this data set the CP value was found to be: CP = 0.71
For this data set the CPK value was found to be: CPK = 0.40
3rd injection molded part:
Plate:
The critical dimension we chose for the plate was the press fit outer ring diameter.
Insert Image of plate with drawing of the dimension
After analyzing the data, the following critical values were found:
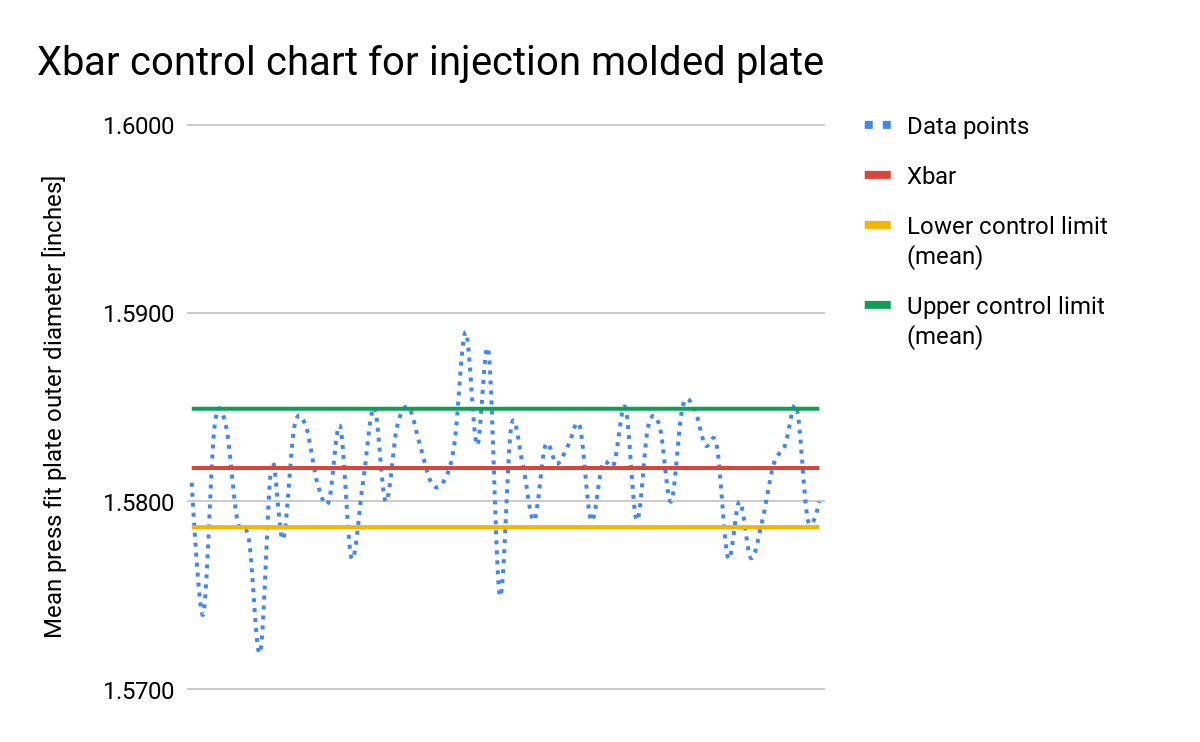
Xbar (inches)
|
1.582
|
Lower control Limit (mean)
|
1.579
|
Upper control limit (mean)
|
1.585
|
Avg of range
|
0.005
|
Lower control limit (range)
|
0.000
|
Upper control limit (range)
|
0.012
|
Below, 3 graphs were made to represent the data. A graph tracking the mean, the range and a
histogram of the data are presented below.
histogram of the data are presented below.
Figure 10: The above graph tracks the data for the donut top, in comparison with the upper and lower
control limits as well as the mean of the data.
Figure 11:: The above graph tracks the range of the donut top, with the average of the range and the
upper and lower control limits also plotted.
Figure 12:: The above graph is a histogram of the dimensions for our donut tops.
For this data set the CP value was found to be: CP = 1.55
For this data set the CPK value was found to be: CPK = 0.07


Comments
Post a Comment